Forage Testing Methodology
The single most important lab decision in PSSM management. The same bale of hay can come back "PSSM-safe" or "unsafe" depending on whether the lab reports ESC, WSC, total NSC, or starch. This review explains what each fraction actually measures, which one predicts whether your horse will tie up, and how to pick one and stay with it across rechecks so trend lines mean something. Pairs with review 02 (the threshold) and review 31 (commercial feed database).
Research thesis
This systematic review argues that forage testing is the single most consequential lab decision in PSSM management, and that the choice between wet chemistry, near-infrared spectroscopy, and ESC and WSC fractionation can move a horse from a "PSSM-safe" diet to an "unsafe" one on its own, not only because labs disagree by three to five percentage points on the same hay, but also because the same hay can be classified two different ways depending on which carbohydrate fraction the lab reports; by comparing the analytical literature on equine forage testing against horse-level clinical outcomes, this review builds a cost-conscious testing protocol, identifies which NSC fraction (ESC, WSC, total NSC, starch) actually predicts tying-up risk, and clarifies when soaking, steaming, or hay rotation is justified by the evidence.
Evidence visualizations & full pages
Evidence figures (2)
Figures referenced by the review's Figure N: captions. Click any chart for a full-size view. They are also rendered inline below their respective captions in the full review text further down.
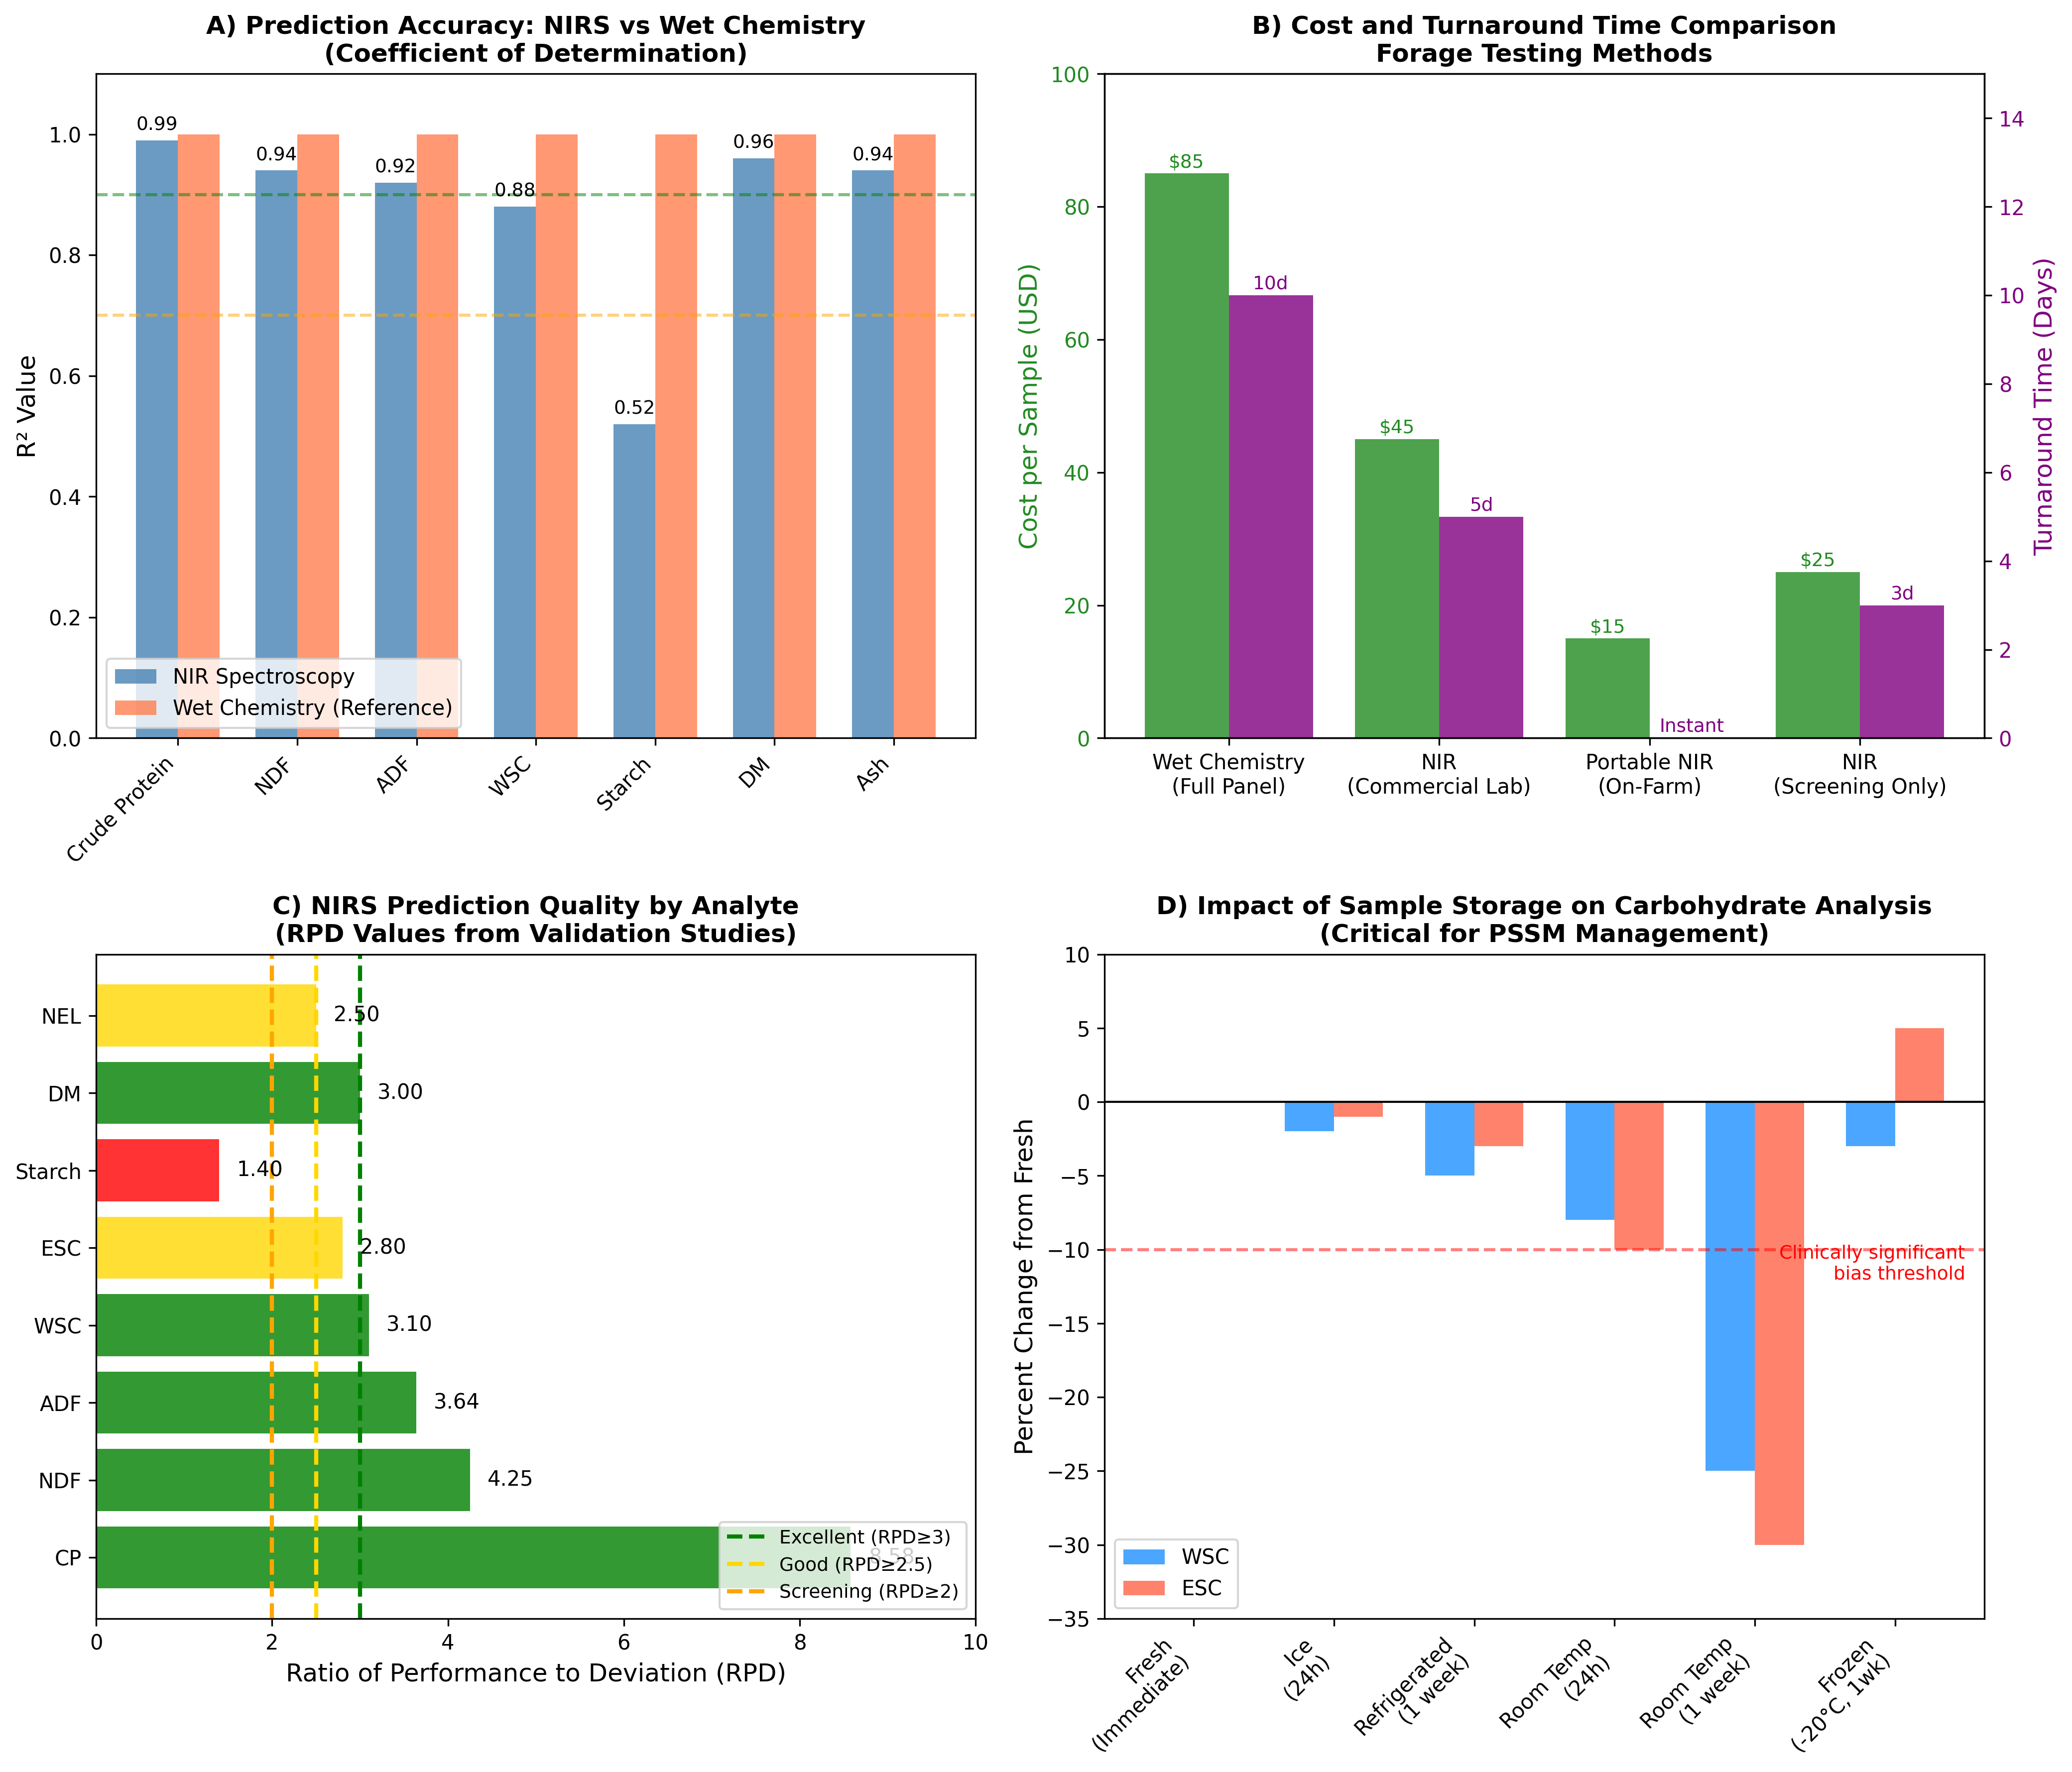 Figure 1: Comparative Analysis of Forage Testing Methods. Panel A compares prediction accuracy (R² values) between NIRS and wet chemistry for various forage parameters. Panel B illustrates cost and turnaround
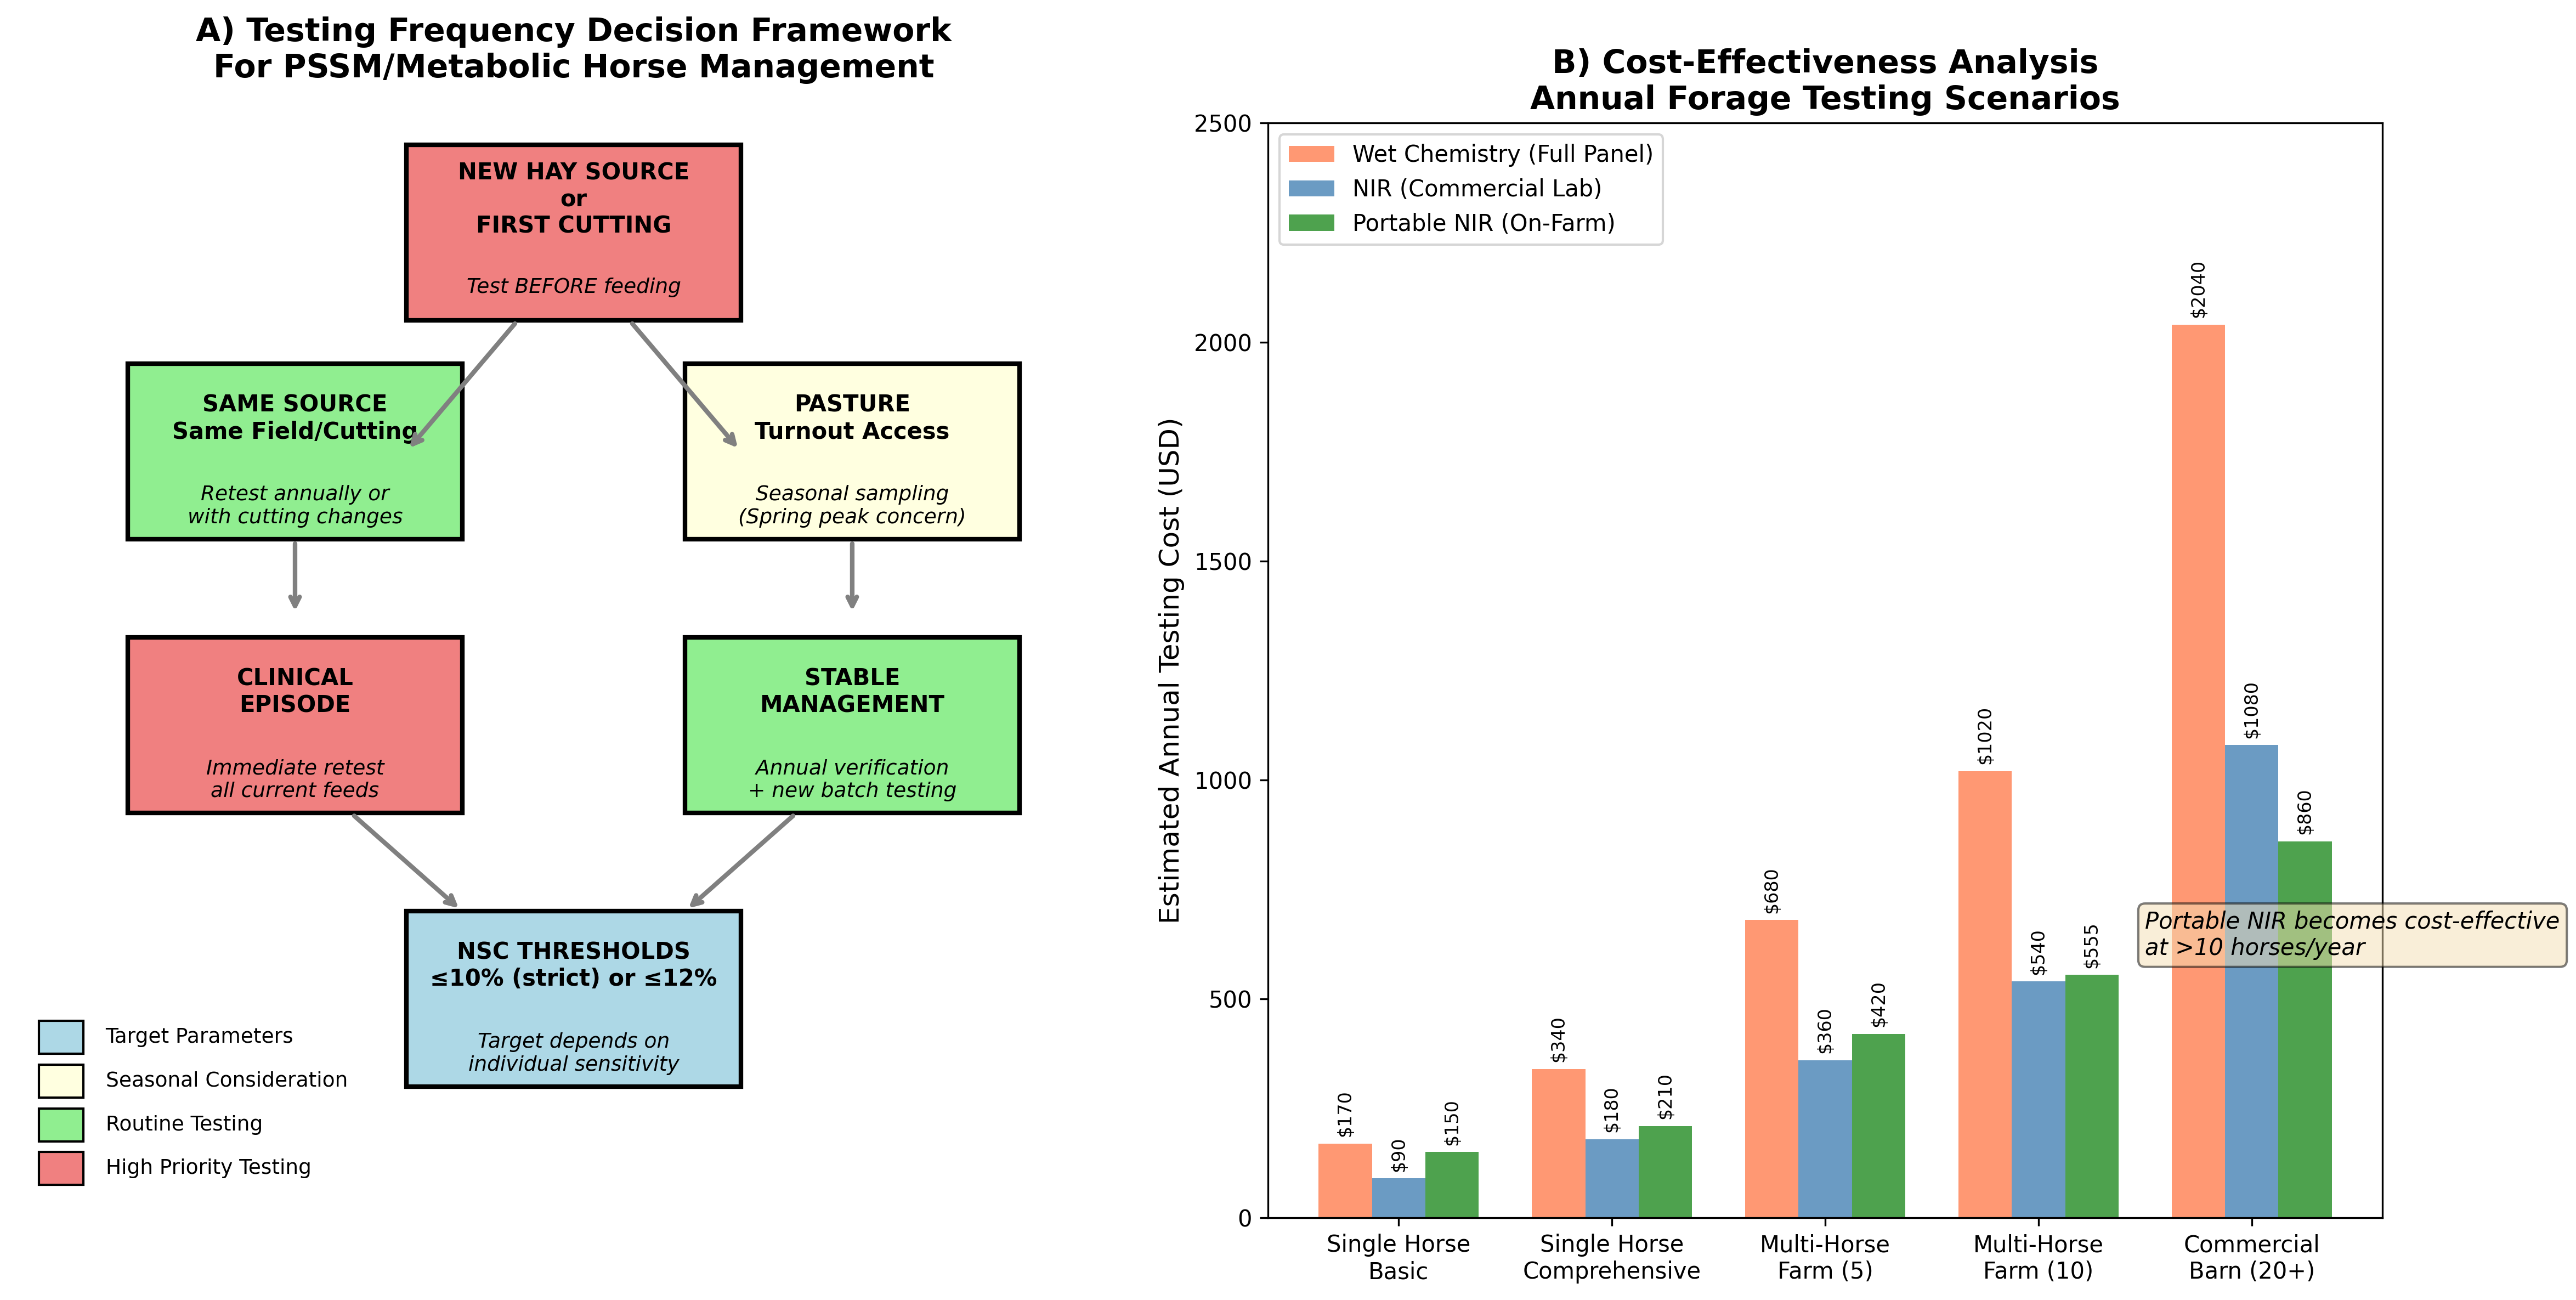 Figure 1: Comparative Analysis of Forage Testing Methods. Panel A compares prediction accuracy (R² values) between NIRS and wet chemistry for various forage parameters. Panel B illustrates cost and turnaround
Original review pages (PDF render)
Download
Full review text
Forage Testing Methodology
Forage Testing Methodology for NSC Determination in PSSM Management: A Systematic Review
1. Introduction and Background
1.1 Rationale for Accurate Forage Testing in Equine Metabolic Disorders
Polysaccharide storage myopathy (PSSM) represents a significant glycogen storage disorder affecting more than 20 breeds of horses, characterized by increased insulin sensitivity, excessive muscle glycogen storage, and the accumulation of amylase-resistant polysaccharide in muscle tissue [1]. Type 1 PSSM (PSSM1) is an autosomal dominant condition that can present with various signs including exertional rhabdomyolysis, while Type 2 PSSM (PSSM2-ER) is a glycogen storage disorder identified primarily in Quarter Horses with an unknown genetic basis. Both forms respond well to a low nonstructural carbohydrate (NSC), high-fat diet combined with regular exercise, making accurate forage analysis essential for effective dietary management.
Forage low in NSC is fundamentally recommended for horses with insulin dysregulation (ID), which underscores the critical importance of accurate forage analysis for PSSM-affected horses [2]. Equine metabolic syndrome (EMS), which shares pathophysiological features with PSSM including insulin dysregulation, has become a prevalent endocrine disorder that increases the risk of hyperinsulinemia-associated laminitis [3]. The central pathological feature of EMS is insulin dysregulation encompassing basal or postprandial hyperinsulinemia and tissue insulin resistance. Environmental and management factors, particularly high-NSC diets and unrestricted pasture access, are primary drivers of disease development.
1.2 Clinical Significance of NSC Thresholds
The feeding of concentrates rich in hydrolyzable carbohydrates (starch and simple sugars) enhances the phenotypic expression of both PSSM and recurrent exertional rhabdomyolysis (RER) [4]. For horses with PSSM, feeding concentrates rich in hydrolyzable carbohydrates may enhance disease expression by increasing the quantity of glucose available for muscle glycogen synthesis. A decrease in frequency and severity of exertional rhabdomyolysis has been observed when horses with PSSM are fed diets with reduced digestible energy from hydrolyzable carbohydrates (<10 to 15% of total diet) and increased energy from fat (15 to 20%). Management is centered on strict dietary NSC restriction, controlled forage intake, and elimination or careful management of pasture access [3].
---
2. Analytical Methods for NSC Determination
2.1 Wet Chemistry Methods
2.1.1 Methodology and Reference Standards
Wet chemistry analysis remains the gold standard for forage nutrient determination, providing the reference values against which all spectroscopic methods are calibrated and validated. Traditional laboratory analytical methods for nutritional profiling are logistically demanding and costly, particularly in large-scale trials, underscoring the need for rapid, precise, and high-throughput evaluation methods [5]. Commercial laboratories including Equi-Analytical and Dairy One utilize standardized wet chemistry protocols for NSC fractionation.
The wet chemistry approach involves separate enzymatic and acid hydrolysis procedures to quantify water-soluble carbohydrates (WSC), ethanol-soluble carbohydrates (ESC), and starch fractions independently. High-performance liquid chromatography (HPLC) is utilized as a reference method for specific carbohydrate identification, though it is time-consuming and creates bottlenecks in sample processing [6].
2.1.2 ESC vs. WSC Fractionation
Ethanol-soluble carbohydrates (ESCs) of cool-season grasses include mono- and disaccharides and sometimes short-chain fructans, which may exacerbate the risk of pasture-associated laminitis [7]. The distinction between ESC and WSC is clinically significant because ESC represents the simple sugars that are rapidly absorbed and directly contribute to glycemic and insulinemic responses, while WSC includes both simple sugars and fructans that may undergo fermentation in the hindgut. For PSSM management, ESC values are often considered more relevant to glycemic impact, though total NSC (WSC + starch) provides the comprehensive picture for dietary planning.
2.2 Near-Infrared Reflectance Spectroscopy (NIRS)
2.2.1 Principles and Instrumentation
Near-infrared reflectance spectroscopy has emerged as a promising alternative to time-consuming and costly chemical analysis for forage nutritional quality assessment [8]. The technology employs molecular absorption principles using near-infrared sections of the electromagnetic spectrum for precise and rapid determination of biochemical parameters in a non-destructive manner [9]. Multiple instrument platforms are available, ranging from benchtop laboratory analyzers to handheld portable devices.
Recent studies have investigated the efficacy of handheld NIRS devices for in-field estimation of forage quality using undried samples [10]. The NeoSpectra, TrinamiX, and AgroCares handheld instruments have been evaluated for key forage quality metrics including crude protein (CP), neutral detergent fiber (aNDF), acid detergent fiber (ADF), and in vitro digestibility parameters. Dynamic scanning patterns (moving and turntable) enhance predictive accuracy compared to static scans. Fiber constituents (ADF, aNDF) and crude protein show higher robustness and minimal impact from water interference.
2.2.2 Calibration and Validation Requirements
Despite the well-documented merits of NIRS for forage nutritive value analysis, recent studies reveal inconsistencies in accuracy of NIR-predicted values [11]. These findings underscore the critical need for robust validation efforts to ensure reliability. Standardized reporting of validation outcomes, including key metrics and best practices, is essential for ensuring data quality and fostering broader adoption of NIRS across research and industry. The development of prediction equations requires multiple regression analysis with calibration sets and cross-validation procedures.
NIRS calibration models for Italian ryegrass achieved high coefficients of determination (R²CV: CP = 0.99, NDF = 0.94, ADF = 0.92, WSC = 0.88) with ratio of performance to deviation values (RPD: CP = 8.58, NDF = 4.25, ADF = 3.64, WSC = 3.10) indicating excellent to good prediction quality [12]. The validation using independent sample sets confirmed these findings (R²V: CP = 0.99, NDF = 0.91, ADF = 0.95, WSC = 0.91).
---
3. Assay Precision and Inter-Laboratory Variability
3.1 Within-Laboratory Precision
Within-run and between-run precision are critical parameters for assessing analytical reliability. Based on methodologies outlined in CLSI guidelines, precision studies typically analyze multiple replicates per day of quality control materials over multiple days [13]. Coefficients of variation (CV) below 10% are generally considered acceptable for routine clinical and agricultural analyses. NIRS prediction equations for chickpea straw demonstrated R² of cross-validation exceeding 0.68 with standard error of prediction below 1%, indicating acceptable precision for screening purposes [14].
The prediction of forage chemical composition by NIRS demonstrates high predictive ability for crude protein (R² = 0.98), crude fiber (R² = 0.95), and ash (R² = 0.94) in hay samples [15]. Only moderate accuracy was characteristic for dry matter (R² = 0.87) and crude fat (R² = 0.75). With exception of ash, deviations from reference methods are comparable to those expected from using the same reference methods in different laboratories.
3.2 Inter-Laboratory Considerations
Inter-laboratory comparison studies are essential for validating method transferability and ensuring consistent results across testing facilities. A validated quality control system demonstrated good precision with reproducibility coefficient of variation of 3.7–20.5% and recovery rates of 89–120% across multiple laboratories [16]. Such validation studies confirm sufficient skills of laboratory personnel and successful method transfer among facilities.
The comparison of analytical results across laboratories requires standardized reference materials and harmonized protocols. Regression analysis and calculated bias between instruments and laboratories should fall within acceptable limits defined by total allowable error specifications [17]. Correlation coefficients (r) ranging from 99.4% to 100% between analyzers indicate excellent standardization and system equivalency.
---
4. Sample Collection and Handling Protocols
4.1 Fresh Forage Sampling
The effect of fresh-forage storage-handling methods significantly impacts nutrient analysis results [2]. Methods compared include microwave-oven treatment (MO; 9kW; 70s then stored at -20°C), room temperature (20°C), refrigeration (3°C), and freezing (-20°C and -80°C). Mixed grass stored at room temperature showed significant reductions in WSC (P=0.009), ESC (P=0.001), and NSC (P=0.006) from 24 hours to 1 week storage. These findings have critical implications for PSSM dietary management where accurate NSC quantification directly impacts clinical decision-making.
To limit metabolic changes and provide accurate nutrient composition results, fresh forage that cannot be quickly analyzed should be transported on ice post-collection to a storage location, then immediately refrigerated where it can be kept up to one week prior to being shipped on ice for analysis [2]. ESC and starch of ryegrass and CP of mixed grass decreased after one week when stored at -80°C (P=0.007; P=0.001; P=0.02), suggesting that even ultra-cold freezing may introduce artifacts over extended storage periods.
4.2 Hay Sampling Considerations
For hay analysis, core sampling methods are standard practice, though optimal protocols for number of cores and sampling depth vary by hay type and bale format. Representative sampling requires collection from multiple bales within a lot, with recommendations typically ranging from 10-20 core samples per lot for statistical representativeness. Post-cure timing affects NSC stabilization, with testing recommended after complete curing (typically 4-6 weeks post-baling) to ensure equilibration of moisture and metabolite content.
4.3 Diurnal and Seasonal Variation
Diurnal variation in carbohydrate content represents a significant consideration for pasture sampling. ESC concentrations increased in the afternoon compared to the morning across all cultivars of cool-season grasses studied [7]. The calibration developed from samples collected in central Kentucky during morning and afternoon periods over two growing seasons achieved accuracy above 95% for ESC prediction. This temporal variation has direct clinical relevance for grazing management of PSSM horses.
---
5. Comparative Analysis of Testing Methods
5.1 Method Performance Summary
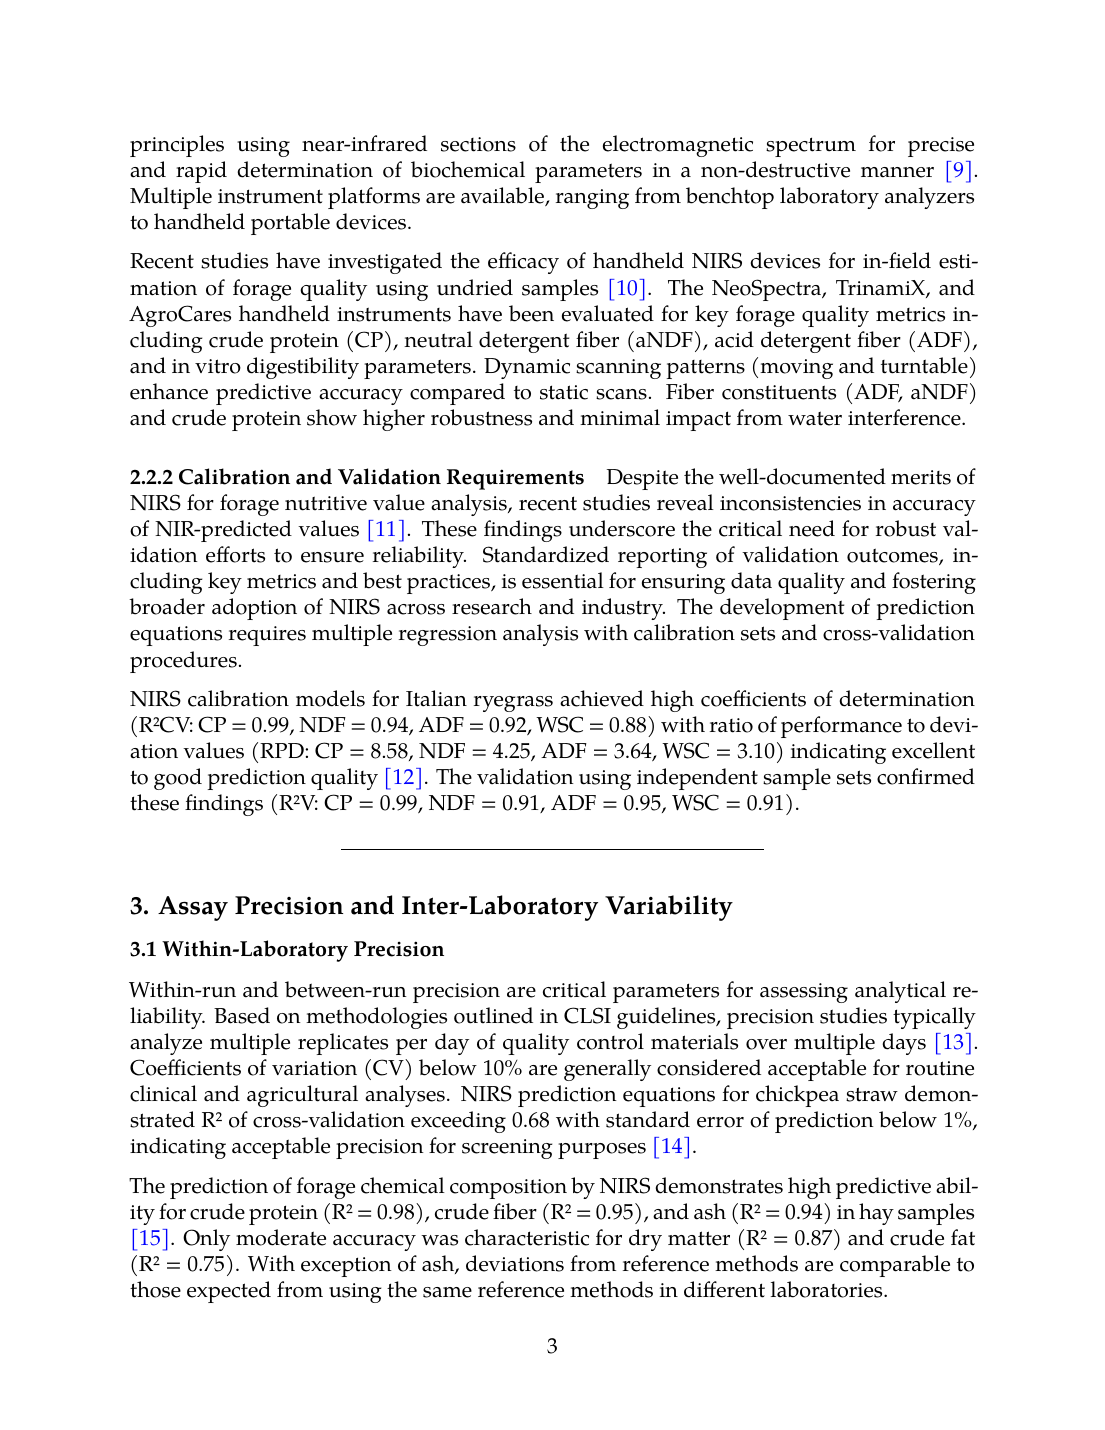
Figure 1: Comparative Analysis of Forage Testing Methods. Panel A compares prediction accuracy (R² values) between NIRS and wet chemistry for various forage parameters. Panel B illustrates cost and turnaround time differences across testing approaches. Panel C presents RPD values indicating prediction quality by analyte. Panel D demonstrates the critical impact of sample storage conditions on carbohydrate analysis accuracy.
| Parameter | NIRS R² | RPD Value | Prediction Quality | Clinical Relevance for PSSM |
|---|---|---|---|---|
| Crude Protein | 0.98-0.99 | 8.58-9.37 | Excellent | Moderate - diet balancing |
| NDF | 0.91-0.95 | 3.44-4.25 | Good | Moderate - fiber content |
| ADF | 0.92-0.95 | 3.64-4.40 | Good | Moderate - digestibility |
| WSC | 0.88-0.91 | 3.10-3.39 | Good | High - NSC calculation |
| ESC | >0.95 | ~2.8 | Good | Critical - sugar content |
| Starch | 0.52 | 1.4 | Screening only | Critical - NSC calculation |
| Dry Matter | 0.87-0.96 | 2.5-3.0 | Good | Moderate - basis correction |
5.2 Limitations of NIRS for Starch Prediction
A critical limitation for PSSM management is the reduced accuracy of NIRS for starch prediction compared to other analytes. Calibration models for starch prediction demonstrated only moderate accuracy (R²cal: 0.52; RPD value: 1.4) owing to narrow or uneven distribution of data over the range evaluated [18]. This limitation necessitates wet chemistry analysis when precise starch quantification is required for horses with severe PSSM requiring strict NSC thresholds (≤10%).
The prediction of starch in intact plant tissues using NIRS presents additional challenges. Accurate calibration models require samples to be freeze-dried and ground for optimal results (R² = 0.85-0.88), while prediction of starch within intact samples showed very low accuracy (R² = 0.19) [19]. This finding has implications for on-farm portable NIRS applications where sample preparation is limited.
---
6. Target Threshold Validation
6.1 Clinical Correlation with PSSM Outcomes
The ≤10% NSC threshold represents a strict target for horses with severe PSSM or high insulin sensitivity, while ≤12% NSC provides a more achievable target for maintenance feeding of less severely affected individuals [4]. A decrease in the frequency and severity of exertional rhabdomyolysis has been documented when horses with PSSM and RER are fed diets with reduced digestible energy from hydrolyzable carbohydrates. Diagnosis of insulin dysregulation should be performed in stages, beginning with basal testing which includes baseline values of insulin and glucose, and concluding with dynamic tests which detect tissue insulin resistance and hyperinsulinemia [20].
The relationship between dietary NSC and clinical outcomes is well-established for EMS management, where management is centered on strict dietary NSC restriction, controlled forage intake, and elimination or careful management of pasture access [3]. Dietary adjustments are key to weight loss in the majority of EMS horses, with recommendations to provide approximately 1.25% of body weight daily. Regular exercise improves insulin sensitivity but must be adapted to laminitic status.
6.2 Validation of Threshold Accuracy
Achieving clinically meaningful threshold validation requires analytical accuracy within ±10% of true values. The ECEIM consensus statement on equine metabolic syndrome emphasizes that EMS is controlled mainly by dietary strategies and exercise programs that aim to improve insulin regulation and decrease obesity where present [21]. Several choices of test exist which examine different facets of insulin dysregulation and other related metabolic disturbances.
---
7. Trace Mineral and Selenium Analysis
7.1 Selenium Testing in Hay
Selenium deficiency or toxicity represents a geographically variable concern in equine nutrition. NIRS measurements can determine a large array of chemical properties including trace elements, though prediction accuracy varies by element concentration [22]. For elements with maximum total values below 3 g kg⁻¹, prediction models become increasingly critical (RPD <2.0). Low concentrations limit the performance of NIRS calibrations, with critical concentration thresholds <0.1 g kg⁻¹ restricting reliable measurements.
The mineral composition analysis of forage by inductively coupled plasma mass spectrometry (ICP-MS) or inductively coupled plasma optical emission spectrometry (ICP-OES) provides accurate reference values for trace elements including selenium [23]. These analytical techniques offer greater precision for elements at low concentrations than NIRS, making them preferable for selenium quantification in hay where regional deficiencies or excesses may have significant clinical implications.
7.2 Comprehensive Mineral Panels
NIRS prediction equations for mineral content in agricultural samples achieved varying levels of accuracy. Analysis of mineral content in chickpea straw samples including Zn, Mn, Ca, Mg, Fe, and P demonstrated predictive utility, though accuracy varied by element [14]. For comprehensive mineral profiling relevant to PSSM horses (including selenium, copper, zinc, manganese, and iron), wet chemistry analysis provides more reliable quantification, particularly for elements at trace concentrations.
---
8. Decision Framework for Testing Frequency
8.1 Risk-Based Testing Protocol
Figure 2: Decision Framework for Forage Testing and Cost-Effectiveness Analysis. Panel A presents a risk-stratified approach to determining testing frequency based on hay source, clinical status, and management intensity. Panel B illustrates cost-effectiveness considerations across different management scenarios.
| Scenario | Recommended Testing Frequency | Method Preference | Rationale |
|---|---|---|---|
| New hay source | Before each new lot | Wet chemistry (full panel) | Unknown NSC profile requires accurate baseline |
| Same source/cutting | Annual verification | NIRS (screening) | Established profile, verify consistency |
| Clinical episode | Immediate | Wet chemistry | Rule out dietary trigger |
| Pasture access | Spring/Fall seasonal | Site-specific assessment | Peak risk periods |
| Stable management | Annual + new batches | NIRS with periodic wet chemistry confirmation | Cost-effective monitoring |
8.2 Portable NIRS Applications
Portable NIRS devices continue to gain popularity among producers and consultants, enabling rapid determination of on-farm feed dry matter concentrations [24]. However, evaluation of variation within handheld units and their comparison with forced-air oven measurements reveals that portable units may predict lower DM values (~4 percentage units) compared to reference methods. Differences may be related to calibration models being created solely with ensiled samples while field use involves unfermented samples.
The practical implementation of portable NIRS for PSSM management requires consideration of calibration validity and potential systematic biases. Portable NIRS might be a viable option on farms for time-sensitive measurements with an appropriate prediction curve. By enabling rapid and reliable assessments, portable units could help managers make more informed decisions regarding forage suitability without waiting for commercial laboratory results.
---
9. Cost-Effectiveness Analysis
9.1 Testing Cost Comparison
| Testing Method | Cost per Sample (USD) | Turnaround Time | Best Application |
|---|---|---|---|
| Wet Chemistry (Full Panel) | $75-100 | 7-14 days | Reference testing, clinical cases |
| NIRS (Commercial Lab) | $35-55 | 3-7 days | Routine screening |
| Portable NIRS (On-Farm) | $15-25 | Immediate | High-volume facilities |
| Wet Chemistry (NSC Only) | $40-60 | 5-10 days | Targeted analysis |
9.2 Annual Cost Projections
The cost-effectiveness of different testing strategies depends on horse population size and testing frequency requirements. For single-horse owners requiring 2-4 tests annually, commercial laboratory analysis (either wet chemistry or NIRS) remains most economical. Portable NIRS becomes cost-effective at farm operations managing >10 horses with frequent testing needs, where the equipment amortization is distributed across multiple tests [5].
Traditional laboratory analytical methods, while logistically demanding and costly, particularly in large-scale trials, remain essential for validation and reference purposes. For research applications and breeding programs requiring screening of large numbers of samples, NIRS offers a fast, cheap, and reliable tool that substantially reduces cost per analysis [14].
---
10. Conclusions and Recommendations
10.1 Key Findings
This systematic review establishes that accurate forage testing methodology is fundamental to successful PSSM dietary management. NIRS provides reliable prediction for most parameters relevant to NSC calculation, with R² values exceeding 0.88 for WSC and 0.91 for validation sets in well-calibrated systems [12]. However, starch prediction remains a limitation of spectroscopic methods, with RPD values below 2.0 indicating screening-only utility [18].
Sample handling critically impacts analytical accuracy, with room temperature storage causing significant NSC losses within one week [2]. Fresh forage samples must be shipped on ice and analyzed promptly to ensure clinically reliable results. Diurnal variation in ESC concentrations necessitates standardized sampling times for pasture evaluation [7].
10.2 Clinical Recommendations
For PSSM management requiring strict NSC thresholds (≤10%), wet chemistry analysis remains the gold standard, particularly for starch quantification and initial hay lot characterization. NIRS screening provides cost-effective monitoring for established hay sources where baseline wet chemistry values exist. Portable NIRS applications offer value for high-volume operations but require periodic correlation with reference methods.
The clinical correlation between dietary NSC restriction and reduced PSSM episodes is well-established [4],[3]. Both PSSM1 and PSSM2-ER respond to low nonstructural carbohydrate, high-fat diet combined with regular exercise [1]. Accurate forage testing enables the dietary precision required for effective long-term management of these challenging metabolic disorders.
10.3 Future Directions
Continued development of NIRS calibration models specifically optimized for equine forage NSC fractionation would enhance the utility of spectroscopic methods for PSSM management. Standardization of reporting practices for NIRS validation, including mandatory independent validation datasets, will improve reliability across commercial laboratories [11]. Integration of portable NIRS with digital health monitoring systems could enable real-time dietary adjustment protocols for high-risk horses.
References
References
Numbered in order of first citation, IEEE style. Each entry links to the original source via DOI or publisher URL.
- A. Firshman and S. Valberg, “Polysaccharide Storage Myopathy.,” The Veterinary clinics of North America. Equine practice, Jan. 2025. doi: 10.1016/j.cveq.2024.11.004. View source
- B. S. Kerley, P. Harris, K. Lea, M. McClendon, and A. Adams, “Effects of storage-handling methods on nutrient analysis of fresh-forage samples.,” Journal of Equine Veterinary Science, Sep. 2024. doi: 10.1016/j.jevs.2024.105182. View source
- F. Bertin, “Diagnosis and management of equine metabolic syndrome,” Equine Veterinary Education, Mar. 2026. doi: 10.1111/eve.70094. View source
- R. Geor, “Role of dietary energy source in the expression of chronic exertional myopathies in horses,” Journal of Animal Science, Jun. 2005. doi: 10.2527/2005.8313_SUPPLE32X. View source
- R. Andrés-Camelo, J. Mazabel, P. Espitia-Buitrago, R. Jauregui, and J. A. Cardoso, “Near-Infrared Spectroscopy and Wet Chemistry Dataset for Forage Nutritional Quality Assessment in Urochloa humidicola,” Data in Brief, May 2025. doi: 10.1016/j.dib.2025.111651. View source
- E. B. Fletcher, M. Rosso, T. Walker, H. Huang, G. Morota, and B. Zhang, “Near-Infrared Reflectance Spectroscopy Calibration for Trypsin Inhibitor in Soybean Seed and Meal,” Agriculture, May 2025. doi: 10.3390/agriculture15101062. View source
- K. J. Kramer, I. Kagan, L. Lawrence, and S. Smith, “Ethanol-Soluble Carbohydrates of Cool-Season Grasses: Prediction of Concentration by Near-Infrared Reflectance Spectroscopy (NIRS) and Evaluation of Effects of Cultivar and Management.,” Journal of Equine Veterinary Science, Jun. 2021. doi: 10.1016/J.JEVS.2021.103421. View source
- A. Benelli, R. Primi, C. Evangelista, R. Spina, M. Milanesi, D. Pietrucci, B. Ronchi, U. Bernabucci, and R. Moscetti, “Predicting Forage Nutritional Quality With Near‐Infrared Spectroscopy,” Journal of Sustainable Agriculture and Environment, Jul. 2025. doi: 10.1002/sae2.70077. View source
- P. Chaukhande, S. K. Luthra, R. N. Patel, S. R. Padhi, P. Mankar, M. Mangal, J. K. Ranjan, A. Solanke, G. P. Mishra, D. C. Mishra, B. Singh, R. Bhardwaj, B. S. Tomar, and A. Riar, “Development and Validation of Near-Infrared Reflectance Spectroscopy Prediction Modeling for the Rapid Estimation of Biochemical Traits in Potato,” Foods, May 2024. doi: 10.3390/foods13111655. View source
- W. Yamada, J. H. Cherney, D. J. R. Cherney, T. Runge, and M. Digman, “Handheld Near-Infrared Spectroscopy for Undried Forage Quality Estimation,” Italian National Conference on Sensors, Aug. 2024. doi: 10.3390/s24165136. View source
- M. S. Castillo, T. Griggs, M. Digman, J. M. B. Vendramini, J. Dubeux, and C. Pedreira, “Reporting forage nutritive value using near‐infrared reflectance spectroscopy,” Crop science, Apr. 2025. doi: 10.1002/csc2.70063. View source
- Z. Yang, G. Nie, L. Pan, Y. Zhang, L. Huang, X. Ma, and X. Zhang, “Development and validation of near-infrared spectroscopy for the prediction of forage quality parameters in Lolium multiflorum,” PeerJ, Oct. 2017. doi: 10.7717/peerj.3867. View source
- M. Pollan, J. Melchior, R. Burnett, J. Wilson, and A. Von Rotz, “A-019 Clinical Laboratory Evaluation of the Analytical Performance of the Atellica IM NT-proBNPII (PBNPII) Assay on the Atellica CI Analyzer,” Clinical Chemistry, Oct. 2025. doi: 10.1093/clinchem/hvaf086.019. View source
- T. Alemu, J. Wamatu, A. Tolera, M. Beyan, M. Eshete, A. Alkhtib, and B. Rischkowsky, “Optimizing near Infrared Reflectance Spectroscopy to Predict Nutritional Quality of Chickpea Straw for Livestock Feeding,” Animals, Nov. 2021. doi: 10.3390/ani11123409. View source
- D. Babnik, “Prediction of chemical composition and energy value of hay by near-infrared reflectance spectroscopy (NIRS),” Acta Agriculturae Slovenica, Dec. 2005. doi: 10.14720/aas.2005.86.1.15204. View source
- P. Jedziniak, Ł. Panasiuk, K. Pietruszka, K. Kolano, and R. Zbytniewski, “Inter-laboratory validation of liquid chromatography–tandem mass spectrometry multi-mycotoxin determination in animal feed – method transfer from the reference laboratory to regional laboratories,” Journal of Veterinary Research, Jul. 2023. doi: 10.2478/jvetres-2023-0045. View source
- D. Bikila, T. Lejisa, Y. Tolcha, C. Bashea, M. Meles, T. Getahun, G. Ashebir, W. Habtu, and F. Challa, “Comparison of Selected Clinical Chemistry Assay Results by two Analyzers: Cobas 6000 (c501) and Cobas Integra 400 Plus.,” Clinical Laboratory, May 2022. doi: 10.7754/Clin.Lab.2021.210734. View source
- S. Alagappan, L. Hoffman, D. Mikkelsen, S. O. Mantilla, P. James, O. Yarger, and D. Cozzolino, “Near Infrared Spectroscopy (NIRS) for monitoring the nutritional composition of black soldier fly larvae (BSFL) and frass.,” The Journal of the Science of Food and Agriculture, Oct. 2023. doi: 10.1002/jsfa.13044. View source
- J. Jones, A. Eyles, C. Claye, T. Rodemann, R. Dambergs, and D. Close, “Prediction of starch reserves in intact and ground grapevine cane wood tissues using near infrared reflectance spectroscopy (NIRS).,” The Journal of the Science of Food and Agriculture, Jan. 2020. doi: 10.1002/jsfa.10253. View source
- O. O. Akinniyi, “Focus on the epidemiology, pathophysiology, diagnosis, and management of insulin dysregulation in horses,” Nutrition and Food Processing, Feb. 2024. doi: 10.31579/2637-8914/191. View source
- A. Durham, N. Frank, C. McGowan, N. Menzies‐Gow, E. Roelfsema, I. Vervuert, K. Feige, and K. Fey, “ECEIM consensus statement on equine metabolic syndrome,” Journal of Veterinary Internal Medicine, Feb. 2019. doi: 10.1111/jvim.15423. View source
- T. Kleinebecker, M. D. M. Poelen, A. Smolders, L. Lamers, and N. Hölzel, “Fast and Inexpensive Detection of Total and Extractable Element Concentrations in Aquatic Sediments Using Near-Infrared Reflectance Spectroscopy (NIRS),” PLoS ONE, Jul. 2013. doi: 10.1371/journal.pone.0070517. View source
- F. Rey-Crespo, M. López-Alonso, and M. Miranda, “The use of seaweed from the Galician coast as a mineral supplement in organic dairy cattle.,” Animal, Apr. 2014. doi: 10.1017/S1751731113002474. View source
- M. R. Pupo, E. C. Diepersloot, E. M. Paula, J. Dórea, L. Ghizzi, and L. Ferraretto, “Real-Time Dry Matter Prediction in Whole-Plant Corn Forage and Silage Using Portable Near-Infrared Spectroscopy,” Animals, Aug. 2025. doi: 10.3390/ani15162349. View source
This review is one of 34 in the Foxwatch research corpus. Methodology: PRISMA 2020-style systematic literature review against PubMed, CAB Abstracts, Scopus, Web of Science, and equine veterinary conference proceedings.